Can Rooftop Solar Change EMF Readings in the Bedroom Below?
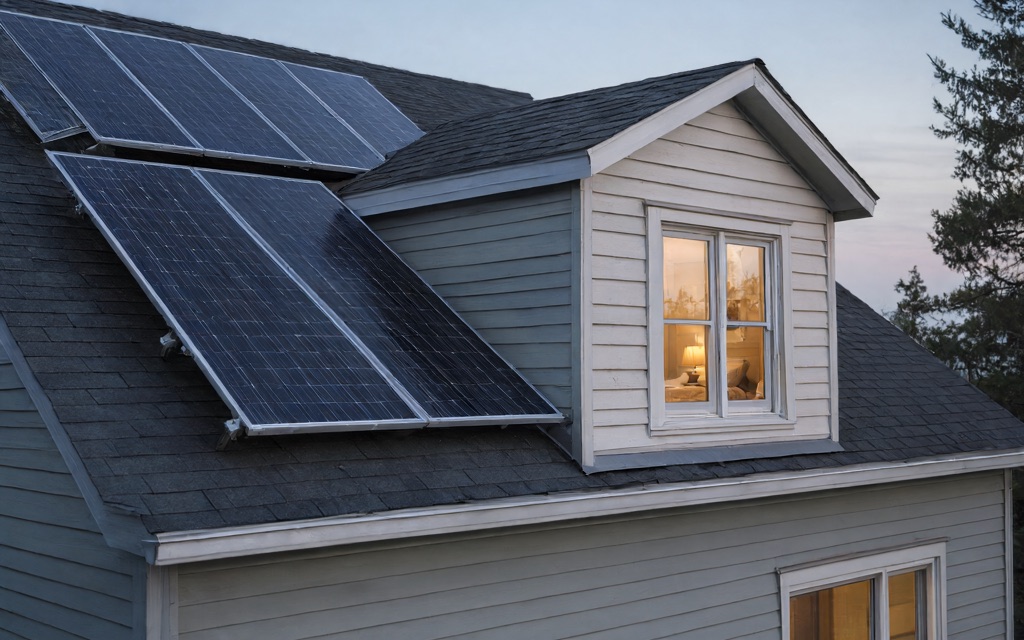
The concrete version of the question: panels cover the roof directly above the bed. What would you actually need to measure, and in what order, to find out?
Here is the concrete version of the question, because vague versions of it do not survive contact with a meter: the photovoltaic panels cover the roof directly above the bed, and you want to know whether the solar equipment changes the readings at pillow height. The honest answer is that it may, and it may not, and the difference between those two is something you can measure, provided you measure the right thing in the right order. This article is the plan: a map of the system, a matching of questions to field types, and a repeatable observation routine you can run from the living room with an ordinary meter.
The Concrete Question
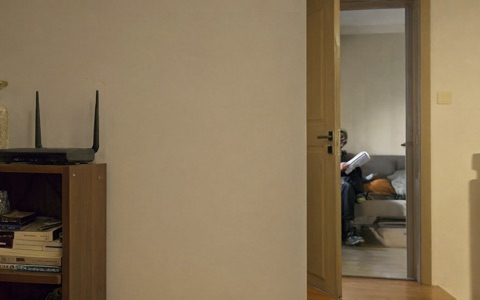
Two details in that question matter more than the anxiety attached to it. First, the location: pillow height, in the room under the roof run. That is where a person spends eight hours, and it is the location a reading would matter most. Second, the comparison: “change” means a difference between readings taken under matched conditions, not a single number compared to a number from a different day. The whole plan below is built to produce that comparison honestly, because the solar system, like the house, is not constant, and one uncontrolled measurement from each condition cannot isolate it.
A Plain Map of the System
A residential solar system, in the order energy moves through it:
- The panels on the roof. They produce direct current, DC. They transmit nothing; they are not a radio and they are not a converter.
- The DC wiring running from the roof, usually through the attic or an exterior chase, to wherever the conversion happens. Current in this cable is what it is: steady or slowly varying DC.
- The conversion equipment. Either microinverters, many small converters mounted on the roof behind the panels, each doing its own job, or a string inverter, one box in a utility room, garage, or on an exterior wall, converting the combined output. This is where switching happens, and it is the piece people least understand, because it is either on the roof or in a room they rarely enter.
- The AC wiring from the conversion equipment to the service panel and the meter, carrying ordinary household current on its way to the house and the grid.
- Optional communication hardware. A monitoring gateway, often a small box near the inverter, that reports production to an app. This is the one part of the system that may be a radio, and it is where the Wi-Fi question lives.
Keep that list in mind, because the next section assigns each part of it to a different measurement, and the most common mistake in this whole topic is asking a 60 Hz magnetic-field meter to answer a radio question, or a radio meter to answer a wiring question. They are different instruments’ jobs.
Which Measurement Answers Which Question
Four field types, and four different questions. The discipline is to match them one to one, because each instrument is blind to the others:
| Question | Field type to measure | What it tells you |
|---|---|---|
| Does current in the wiring and inverter reach the bedroom? | Power-frequency magnetic field, in µT or mG | The 60 Hz field from AC wiring and inverter switching, at the locations you occupy |
| Is there an electric field around the equipment or cabling? | Power-frequency electric field, in kV/m | Whether insulated conductors at voltage are close enough to the room to matter |
| Is the monitoring gateway, or anything else wireless, transmitting in or near the bedroom? | Radiofrequency, in V/m or µW/cm², covering the gateway’s band | Whether the optional communication hardware adds a measurable RF presence indoors |
| Is the inverter injecting high-frequency noise onto the house wiring? | Conducted electrical noise, a separate measurement | Whether switching equipment is adding high-frequency content to the wiring itself, which a field meter beside a device will not necessarily show |
Two notes on that table. First, the magnetic-field row is the one that will usually do the work, because current-carrying conductors are the most persistent source in any home, and the inverter and the DC cabling both carry current. Second, the conducted-noise row is a different measurement entirely: it is taken on the wiring, with an instrument built for that job, and it belongs to the “dirty electricity” family of measurements, covered in our guide to what dirty electricity is and how it affects a home. Do not let a good magnetic-field reading stand in for it, or vice versa.
And a word on the equipment itself: manufacturers publish documentation for their inverters and gateways, and your specific system’s documents, not a general article, are the authority on its communication method and its emissions. Not every installation is the same: one roof may have microinverters and a Wi-Fi gateway, another a string inverter and a cellular reporter, and the two systems answer the measurement questions above with different numbers. Ask your installer for the model numbers before measuring; the plan below uses them.
Why One Daytime-versus-Nighttime Comparison Cannot Isolate the Cause
The tempting shortcut is to measure at noon, measure at midnight, and subtract. The subtraction does not work, for the simple reason that “solar on” and “solar off” are not the only things that differ between those two times. The house is different: lighting, the heating system, the refrigerator cycle, a charger on the nightstand, the neighbors’ loads on the same service. The system is different in ways the sun does not control: a battery, if you have one, may be discharging at night while the panels are dark, so “night” is not “system idle.” Even the sky is different, because a cloudy noon and a clear noon are two different production states wearing the same clock time.
What isolates the cause is not the clock. It is recording the state: what the system was doing at each reading, from the system’s own monitoring display or app, written down next to the field reading. The state column, production, charging, discharging, or idle, is what lets a dozen noisy readings from different days be compared as if they came from one experiment. It costs a note and a glance at the app, and it is the difference between data and anecdotes.
A Repeatable Observation Plan
The plan has five rules, and the log below is its shape. Nothing in the plan requires roof access, panel contact, or any work on the equipment. You measure from the occupied rooms, in the states the system is already in; if you need a state the system is not in, that is a request for the installer, not a task for the homeowner.
- Same locations. Choose them once: pillow height at the head of the bed, the center of the bed, and one standing position near the wall under the roof run. Write them down and never move them.
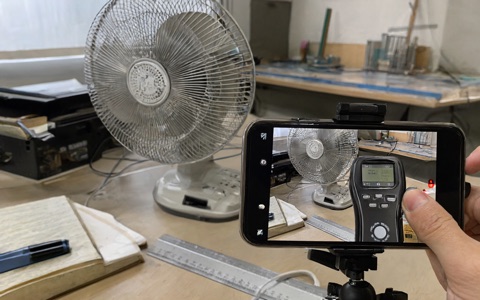
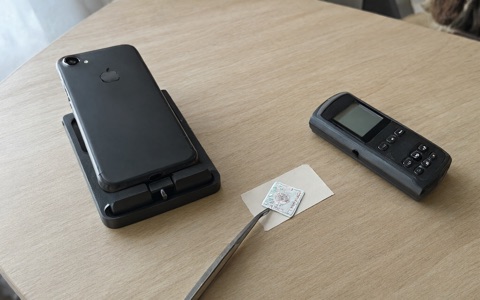
- Same instrument settings and orientation. One meter, one mode, the same facing, every time. Note the mode on the log, because a mode change is an experiment change.
- Recorded time and system state. The clock, and what the monitoring display says the system is doing, on every row.
- Household conditions noted. Heating or cooling on or off, which appliances are running, which lights are on, whether the monitoring gateway’s indicator is lit.
- Repetition across days. A few readings per day, over a stretch of days that includes clear, cloudy, and dark periods, so that production varies for reasons you have recorded rather than guessed.
| Date | Time | Location and height | Field type and unit | Reading | System state (from app) | HVAC | Appliances / lights | Gateway indicator | Notes |
|---|---|---|---|---|---|---|---|---|---|
After a few days, the comparison you actually wanted is in that table: readings at the same locations, in the same state, versus readings in the other states, with the house’s own activity logged beside them so it cannot hide inside the difference. If the rows separate cleanly, you have your answer. If they do not, you have found out that the system’s contribution is small relative to the house’s own activity, which is also an answer, and arguably the more useful one.
Sources
- Manufacturer documentation for your specific inverter, microinverter, and monitoring gateway models, for communication method and published emissions information.
- Your installer’s system design documents, for equipment locations and conductor routes.
This article describes a measurement plan for a home you occupy. It is not a diagnosis of any system, and it is not a recommendation to remove working solar equipment.
Common questions
Frequently asked questions
The panels produce direct current; they do not transmit radio and they carry current that is present only in the day. The interesting electromagnetic activity in a photovoltaic system is downstream of the glass: in the conversion equipment, the wiring, and any optional communication hardware. Pointing a meter at the sky measures the sky.
The panels and the microinverters do not, on their own. What can add a radio is the optional monitoring gateway, the small box that connects the system to the internet so the app shows production. Many such gateways use 2.4 GHz Wi-Fi; some use a cellular connection. The gateway, not the roof, is the RF question, and its location is a choice the installer makes.
It answers one of the four questions and only one. A power-frequency magnetic-field measurement tells you about current in the wiring and in the inverter at 60 Hz. It will not see a Wi-Fi gateway, and it will not see steady direct current in DC cabling. The right instrument depends on which question you are asking, which is why the plan below names the field type on every row.
Not from this article, and not from a reading alone. The measurement tells you where the equipment’s fields arrive; what to do about a location is a decision between you and the installer, who can move a gateway or reroute cabling, or an electrician, for anything on the service side. Removal is an energy decision, not a measurement conclusion, and a survey that documents the readings gives you the information to have that conversation on facts.
The design takes an afternoon and the data takes a few days of five-minute sessions. The same locations, the same meter settings, a note of what the system is doing and what else the house is doing, repeated across different production levels. It is deliberately small: the goal is to separate the solar system from the rest of the house, and that separation is a repetition problem, not a duration problem.